

- Background
- Schema
- Development of metrics
- SCOM adjustments
- Setup SQL Exporter
- VictoriaMetrics agent
- Final result
- Conclusion
The purpose of this post is to outline the technical considerations behind a solution that visualizes performance data collected by Microsoft System Center Operations Manager (SCOM) agents on Grafana dashboards.
At the moment there are several solutions to display SCOM data in Grafana:
- https://www.opslogix.com/knowledgebase/getting-started-with-the-scom-plugin-for-grafana
- https://silect.com/grafana-dashboards-for-scom-free-edition/
- https://medium.com/@houcembenmahfoudh/dashboarding-scom-metrics-in-grafana-a1018f0aea3d
- and even for Azure SCOM MI https://learn.microsoft.com/en-us/azure/azure-monitor/scom-manage-instance/query-scom-managed-instance-data-on-grafana
All of these solutions use the direct connection to SCOM databases hosted on MS SQL instances as a data source for Grafana.
However I was challenged with another case.
Background
The company was finding SCOM performance views very inconvenient. Along with SCOM reporting it is the nightmare for people with unwillingness to dive into classes and instances of monitored objects. Also they were not happy with approximated data on charts, that was caused by default tolerance setting in performance collection rules. Another annoying thing is the performance of SCOM databases having hundreds gigabytes of data and serving thousands agents. Generally it’s the usual story.
At that moment the company had already been using VictoriaMetrics with Grafana to display data from some network devices. Grafana is the one of the best mean for visualization of performance data present in metrics from Prometheus-like database. Grafana has impressive performance in ability to show big amount data simultaneously and to perform transformation on the fly. So it was supposed I need to use VictoriaMetrics agent (VMagent) to push data into Victoria Metrics database with using authorization provided by VMagent.
OK, challenge accepted.
Schema
I selected SQL Exporter for Prometheus as the solution to transform performance data collected by SCOM agents into metrics. SQL Exporter is a configuration driven exporter that exposes metrics gathered from databases. In my case SQL Exporter had to expose data stored in SCOM warehouse database. Of course, it is possible to get data from SCOM operational database however a warehouse databases also contains fresh performance data because of the most of SCOM performance collecting rules have the second write action to publish data into a warehouse database and this fact allows us to avoid any impact to performance of operational database.
So, the scheme of data flow should look as:
Windows → SCOM agent → SCOM Warehouse database → SQL Exporter for Prometheus → VictoriaMetrics agent → Victoria database → Grafana dashboard.
🟡 WARNING
The technical details provided below are illustrative and not an exact copy of my actual solution. All examples are for explanation purposes only, as the real configuration includes business-specific settings and labels. Additionally, I used certain hard-coded values within the SQL queries to improve performance.
Development of metrics
It is important to follow naming rules defined in Data model and Metric and label naming articles in Prometheus documentation.
SCOM can provide data “ready to use” by doing calculation on agents, it allows us to avoid mathematics on Grafana dashboard and to use GAUGE type of metrics:
🟣 NOTE
“Percent Memory Used” and “System Uptime Collection Rule” are my custom performance collection rules to measure consuming of physical memory and system uptime accordingly.
| Metric | Type | SCOM Object/Counter |
|---|---|---|
| windows_cpu_processor_performance_ratio | gauge | Processor Information/% Processor Time |
| windows_system_processor_queue_length | gauge | System/Processor Queue Length |
| windows_memory_physical_used_ratio | gauge | Memory/PercentMemoryUsed |
| windows_memory_committed_used_ratio | gauge | Memory/% Committed Bytes In Use |
| windows_logical_disk_free_ratio | gauge | LogicalDisk/% Free Space |
| windows_logical_disk_requests_queued | gauge | LogicalDisk/Current Disk Queue Length |
| windows_logical_disk_free_mbytes | gauge | LogicalDisk/Free Megabytes |
| windows_net_bytes_received_per_second | gauge | Network Adapter/Bytes Received/sec |
| windows_net_bytes_sent_per_second | gauge | Network Adapter/Bytes Sent/sec |
| windows_net_bytes_total_per_second | gauge | Network Adapter/Bytes Total/sec |
| windows_net_current_bandwidth_ratio | gauge | Network Adapter/ PercentBandwidthUsedTotal |
| windows_system_uptime_total | counter | System/Uptime |
The second step is to define labels:
| Label | Description |
|---|---|
| Path | The name of computer containing a monitored object. |
| Object | A monitored object. |
| Instance | Instance of a monitored object (in case of there are several instances on the same computer). |
| Counter | Performance counter or calculated field. |
| Domain | Active Directory domain (calculated from Path field). |
SCOM adjustments
Firstly, it needs to tune performance collection rules (by overrides) to have all data points in a desired interval. It is reached by disabling tolerance and by adjusting frequency to a desired interval:
| Rule | Object/Counter | Frequency | Maximum Sample Separation | Tolerance |
|---|---|---|---|---|
| Processor % Processor Time Total Windows Server 2016 and above | Processor Information/% Processor Time | 60 | 1 | 0 |
| System Processor Queue Length Windows Server 2016 and above | System/Processor Queue Length | 60 | 1 | 0 |
| Memory % Committed Bytes in Use Windows Server 2016 and above | Memory/% Committed Bytes In Use | 300 | 1 | 0 |
| Percent Memory Used | Memory/PercentMemoryUsed | 60 | 1 | 0 |
| % Logical Disk Free Space Windows Server 2016 and above | LogicalDisk/% Free Space | 300 | 1 | 0 |
| Collection rule for Current Disk Queue Length Windows Server 2016 and above | LogicalDisk/Current Disk Queue Length | 300 | 1 | 0 |
| Logical Disk Free Megabytes Windows Server 2016 and above | LogicalDisk/Free Megabytes | 300 | 1 | 0 |
| Network Adapter Bytes Received per Second Windows Server 2016 and above | Network Adapter/Bytes Received/sec | 60 | 1 | 0 |
| Network Adapter Bytes Sent per Second Windows Server 2016 and above | Network Adapter/Bytes Sent/sec | 60 | 1 | 0 |
| Percent Bandwidth Used Total | Network Adapter/ PercentBandwidthUsedTotal | 60 | – | – |
| Network Adapter Bytes Total per Second Windows Server 2016 and above | Network Adapter/Bytes Total/sec | 60 | 1 | 0 |
| System Uptime Collection Rule | System/Uptime | 600 | – | – |
🟣 NOTE
The rule “System Uptime Collection Rule” is based on the standard data source “Microsoft.Windows.WmiPerfCounterProvider” so it has no “Tolerance” setting.
Of course, we need to keep in mind “zero tolerance” in performance collection rules leads grow of databases’ size and the right capacity management is needed here.
Then I created a special view within data warehouse database to unify a data source for SQL exporter: [OperationsManagerDW].[dbo].[vGrafanaCommonDataset].
SQL view’s design (GitHub link):
WITH BaseSet AS (
    SELECT
        PerformanceRuleInstanceRowId,
        ManagedEntityRowId,
        MAX(DateTime) AS DateTime
    FROM
        Perf.vPerfRaw
    WHERE
        DateTime > DATEADD(MINUTE, -10, GETDATE())
    GROUP BY
        PerformanceRuleInstanceRowId, ManagedEntityRowId
)
SELECT
    vme.Path,
    SUBSTRING(vme.Path, CHARINDEX('.', vme.Path) + 1, LEN(vme.Path)) AS Domain,
    vpr.ObjectName AS Object,
    vpr.CounterName AS Counter,
    vpri.InstanceName AS Instance,
    ROUND(pvpr.SampleValue, 0) AS Value,
FROM
    Perf.vPerfRaw AS pvpr
    INNER JOIN dbo.vManagedEntity AS vme
        ON pvpr.ManagedEntityRowId = vme.ManagedEntityRowId
    INNER JOIN dbo.vPerformanceRuleInstance AS vpri
        ON pvpr.PerformanceRuleInstanceRowId = vpri.PerformanceRuleInstanceRowId
    INNER JOIN dbo.vPerformanceRule AS vpr
        ON vpr.RuleRowId = vpri.RuleRowId
    INNER JOIN BaseSet
        ON pvpr.ManagedEntityRowId = BaseSet.ManagedEntityRowId
        AND pvpr.PerformanceRuleInstanceRowId = BaseSet.PerformanceRuleInstanceRowId
        AND pvpr.DateTime = BaseSet.DateTime
WHERE
    (
        vpr.ObjectName = 'Processor Information'
        OR vpr.ObjectName = 'System'
        OR vpr.ObjectName = 'Memory'
        OR vpr.ObjectName = 'LogicalDisk'
        OR vpr.ObjectName = 'Network Adapter'
    )
    AND pvpr.DateTime > DATEADD(MINUTE, -10, GETDATE())
The CTE (Common Table Expression) named BaseSet represens the latest samples per counter/entity in the last 10 minutes. This CTE compensates delays and irregular copying of data from the data staging table Perf.PerformanceStage into Perf.PerRaw_* tables.
Setup SQL Exporter
SQL exporter can be set up on any computer having connection to SCOM data warehouse server. I placed the service right on “SCOMDWSRV” server:
- Create a new folder “sql_exporter” under “C:\Program Files”.
- Download the latest release named like
sql_exporter-*.*.*.windows-amd64.zipfrom https://github.com/burningalchemist/sql_exporter/releases . - Create a new service by running Powershell cmdlet (GitHub link):
New-Service -name 'SqlExporterSvc' -BinaryPathName '"C:\Program Files\sql_exporter\sql_exporter.exe" --config.file "C:\Program Files\sql_exporter\sql_exporter.yml"' -StartupType 'Automatic' -DisplayName 'Prometheus SQL Exporter'
Be sure the user account of ‘SqlExporterSvc’ service has “db_datareader” permission in “OperationsManagerDW” database. I prefer to use Group Managed Service Accounts (GMSA) for any Windows service if it is possible. In this case I also configured GMSA for ‘SqlExporterSvc’ service however description of this is outside of the article’s context. The single what I want to mention is I configured Service Principal Names for that account:
HTTP/SCOMDWSRV:9399
HTTP/SCOMDWSRV.contoso.com:9399
Configuration file for the service sql_exporter.yml (GitHub link):
# Global defaults.
global:
  # If scrape_timeout <= 0, no timeout is set unless Prometheus provides one. The default is 10s.
  scrape_timeout: 40s
  # Subtracted from Prometheus' scrape_timeout to give us some headroom and prevent Prometheus from timing out first.
  scrape_timeout_offset: 500ms
  # Minimum interval between collector runs: by default (0s) collectors are executed on every scrape.
  min_interval: 0s
  # Maximum number of open connections to any one target. Metric queries will run concurrently on multiple connections,
  # as will concurrent scrapes.
  max_connections: 3
  # Maximum number of idle connections to any one target. Unless you use very long collection intervals, this should
  # always be the same as max_connections.
  max_idle_connections: 3
  # Maximum number of maximum amount of time a connection may be reused. Expired connections may be closed lazily before reuse.
  # If 0, connections are not closed due to a connection's age.
  max_connection_lifetime: 5m

# The target to monitor and the collectors to execute on it.
target:
  # Data source name always has a URI schema that matches the driver name. In some cases (e.g. MySQL)
  # the schema gets dropped or replaced to match the driver expected DSN format.
  data_source_name: 'sqlserver://SCOMDWSRV:1433'

  # Collectors (referenced by name) to execute on the target.
  # Glob patterns are supported (see <https://pkg.go.dev/path/filepath#Match> for syntax).
  collectors: [mssql_*,scom_database]

# Collector files specifies a list of globs. One collector definition is read from each matching file.
# Glob patterns are supported (see <https://pkg.go.dev/path/filepath#Match> for syntax).
collector_files:
  - "*.collector.yml"
mssql_standard.collector.yml (GitHub link). I left it default just for statistics:
# A collector defining standard metrics for Microsoft SQL Server.
#
# It is required that the SQL Server user has the following permissions:
#
#   GRANT VIEW ANY DEFINITION TO
#   GRANT VIEW SERVER STATE TO
#
collector_name: mssql_standard

# Similar to global.min_interval, but applies to the queries defined by this collector only.
#min_interval: 0s

metrics:
  - metric_name: mssql_local_time_seconds
    type: gauge
    help: 'Local time in seconds since epoch (Unix time).'
    values: [unix_time]
    query: |
      SELECT DATEDIFF(second, '19700101', GETUTCDATE()) AS unix_time

  - metric_name: mssql_connections
    type: gauge
    help: 'Number of active connections.'
    key_labels:
      - db
    values: [count]
    query: |
      SELECT DB_NAME(sp.dbid) AS db, COUNT(sp.spid) AS count
      FROM sys.sysprocesses sp
      GROUP BY DB_NAME(sp.dbid)
The part of scom_database.collector.yml (the full version of the file is available on GitHub):
# A collector defining standard metrics for Microsoft SQL Server.
#
# It is required that the SQL Server user has the following permissions:
#
#   GRANT VIEW ANY DEFINITION TO
#   GRANT VIEW SERVER STATE TO
#
collector_name: scom_database

# Similar to global.min_interval, but applies to the queries defined by this collector only.
#min_interval: 0s

metrics:
  - metric_name: windows_cpu_processor_performance_ratio
    type: gauge
    help: '% Processor Time'
    key_labels:
      - Path
      - Domain
      - Object
      - Counter
    values:
      - Value
    query: |
      SELECT [Path],[Domain],[Object],[Counter],[Value]
      FROM [OperationsManagerDW].[dbo].[vGrafanaCommonDataset]
      where Counter = '% Processor Time'

# the full version of the file is available on GitHub: https://github.com/degotkov/scomgrafanaproject/blob/main/scom_database.collector.yml
After this SQL exporter is available by URL: http://SCOMDWSRV:9399/metrics
Be aware, this exporter supports TLS for enhanced security.
On this step performance data can already be scrapped by Prometheus. As I noted above in my case VictoriaMetric has to be used to scrap data from the exporter.
VictoriaMetrics agent
VictoriaMetrics does not provide a native Windows Service installer or built-in functionality to run directly as a Windows Service. However, we can configure VictoriaMetrics components to run as Windows Services by using third-party tools.. To enable VMAgent to run as a windows service I used Windows Service Wrapper (WinSW). For VMagent instance I reused existing sql_exporter directory.
The procedure of installation:
- Download the latest version of agent vmutils-windows-amd64-vX.XXX.X.zip from GitHub https://github.com/VictoriaMetrics/VictoriaMetrics/releases
- Extract
vmagent-windows-amd64-prod.exeand place it under C:\Program Files\sql_exporter - Create C:\Program Files\sql_exporter\VMAgent.xml (GitHub link) configuration file and fill it with your specific parameters:
<service>
  <id>VMAgent</id>
  <name>VMAgent</name>
  <description>This service is a service created from a sample configuration</description>
  <executable>%BASE%\vmagent-windows-amd64-prod.exe</executable>
  <onfailure action="restart" delay="10 sec"/>
  <onfailure action="restart" delay="20 sec"/>
  <resetfailure>1 hour</resetfailure>
  <arguments>-envflag.enable</arguments>
  <priority>Normal</priority>
  <stoptimeout>15 sec</stoptimeout>
  <stopparentprocessfirst>true</stopparentprocessfirst>
  <startmode>Automatic</startmode>
  <waithint>15 sec</waithint>
  <sleeptime>1 sec</sleeptime>
  <logpath>%BASE%\logs</logpath>
  <log mode="roll">
    <sizeThreshold>10240</sizeThreshold>
    <keepFiles>8</keepFiles>
  </log>
  <env name="loggerFormat" value="json" />
  <env name="loggerOutput" value="stderr" />
  <env name="remoteWrite_oauth2_tokenUrl" value="https://<your_victoria_metrics_host>/oauth/token" />
  <env name="remoteWrite_oauth2_clientID" value="<your_oauth2_clientID>" />
  <env name="remoteWrite_oauth2_clientSecret" value="your_oauth2_clientSecret" />
  <env name="remoteWrite_oauth2_scopes" value="metrics.write" />
  <env name="remoteWrite_url" value="https://<your_victoria_metrics_host>/insert/prometheus" />
  <env name="remoteWrite_maxDiskUsagePerURL" value="52428800" />
  <env name="promscrape_suppressScrapeErrors" value="false" />
  <env name="promscrape_config" value="C:\Program Files\sql_exporter\promscrape.yml" />
 </service>
- Download the latest version of WinSW from https://github.com/winsw/winsw/releases
- Rename WinSW-x64.exe to VMAgent.exe and move it to C:\Program Files\sql_exporter
- Run elevated Powershell terminal and execute commands (GitHub link):
& "C:\Program Files\sql_exporter\VMAgent.exe" install VMAgent.xml
Get-Service VMAgent | Start-Service
🟣 NOTE
For WinSW, the XML configuration file must have the same name as the executable.
- Since XML contains secrets we can remove Users and Trusted Installer from Directory (GitHub link):
# Restrict folder access to system administrators to ensure users cannot read secrets
$Folder = "C:\Program Files\sql_exporter"
# Remove permissions inheritance
$Acl = Get-Acl -Path $Folder
$Acl.SetAccessRuleProtection($True, $True)
Set-Acl -Path $Folder -AclObject $Acl
# Remove users
$Acl = Get-Acl -Path $Folder
$Users = "BUILTIN\Users","NT SERVICE\TrustedInstaller"
foreach ($User in $Users)
{
	$Rule = New-Object system.security.AccessControl.FileSystemAccessRule("$User","Read",,,"Allow")
	$acl.RemoveAccessRuleAll($rule)
}
Set-Acl -Path $Folder -AclObject $Acl
- Create a scrape config for VMagent promscrape.yml (GitHub link):
global:
  scrape_interval: 60s
  scrape_timeout: 40s
  external_labels:
    source: SCOM
scrape_configs:
  - job_name: scom_exporter
    static_configs:
      - targets: ['SCOMDWSRV:9399']
        labels:
          environment: TEST
- Start VMagent.
VictoriaMetrics Agent can now scrape data from the SQL exporter and populate the database with metrics.
The setup of the VictoriaMetrics host and its database, along with the Grafana integration, is beyond the scope of this article. As mentioned earlier, the focus is on illustrating the workflow for transforming SCOM performance data into Prometheus-compatible metrics.
Final result
Here’s what we have in the end.
SQL exporter folder structure:
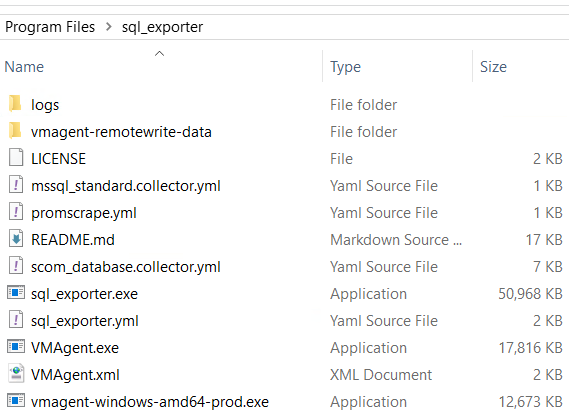
Metrics on http://SCOMDWSRV:9399/metrics page:
# HELP mssql_connections Number of active connections.
# TYPE mssql_connections gauge
mssql_connections{db="OperationsManagerDW"} 29
mssql_connections{db="ReportServer"} 4
mssql_connections{db="master"} 38
mssql_connections{db="msdb"} 4
# HELP mssql_local_time_seconds Local time in seconds since epoch (Unix time).
# TYPE mssql_local_time_seconds gauge
mssql_local_time_seconds 1.764456287e+09
# HELP scrape_errors_total Total number of scrape errors per job, target, collector and query
# TYPE scrape_errors_total counter
scrape_errors_total{collector="mssql_standard",job="",query="mssql_connections",target=""} 35
scrape_errors_total{collector="mssql_standard",job="",query="mssql_local_time_seconds",target=""} 87
scrape_errors_total{collector="scom_database",job="",query="windows_cpu_processor_performance_ratio",target=""} 145
scrape_errors_total{collector="scom_database",job="",query="windows_logical_disk_free_mbytes",target=""} 187
scrape_errors_total{collector="scom_database",job="",query="windows_logical_disk_free_ratio",target=""} 166
scrape_errors_total{collector="scom_database",job="",query="windows_logical_disk_requests_queued",target=""} 139
scrape_errors_total{collector="scom_database",job="",query="windows_memory_committed_used_ratio",target=""} 147
scrape_errors_total{collector="scom_database",job="",query="windows_memory_physical_used_ratio",target=""} 145
scrape_errors_total{collector="scom_database",job="",query="windows_net_bytes_received_per_second",target=""} 152
scrape_errors_total{collector="scom_database",job="",query="windows_net_bytes_sent_per_second",target=""} 161
scrape_errors_total{collector="scom_database",job="",query="windows_net_bytes_total_per_second",target=""} 173
scrape_errors_total{collector="scom_database",job="",query="windows_net_current_bandwidth_ratio",target=""} 159
scrape_errors_total{collector="scom_database",job="",query="windows_system_processor_queue_length",target=""} 133
scrape_errors_total{collector="scom_database",job="",query="windows_system_uptime_total",target=""} 49
# HELP windows_cpu_processor_performance_ratio % Processor Time
# TYPE windows_cpu_processor_performance_ratio gauge
windows_cpu_processor_performance_ratio{Counter="% Processor Time",Domain="domain1.name",Object="Processor Information",Path="servername1.domain1.name"} 8
windows_cpu_processor_performance_ratio{Counter="% Processor Time",Domain="domain2.name",Object="Processor Information",Partner="",Path="servername2.domain2.name"} 4
...
windows_logical_disk_free_mbytes{Counter="Free Megabytes",Domain="domain1.name",Instance="R:",Object="LogicalDisk",Path="servername1.domain1.name"} 5052
windows_logical_disk_free_mbytes{Counter="Free Megabytes",Domain="domain2.name",Instance="C:",Object="LogicalDisk",Path="servername2.domain2.name"} 11790
...
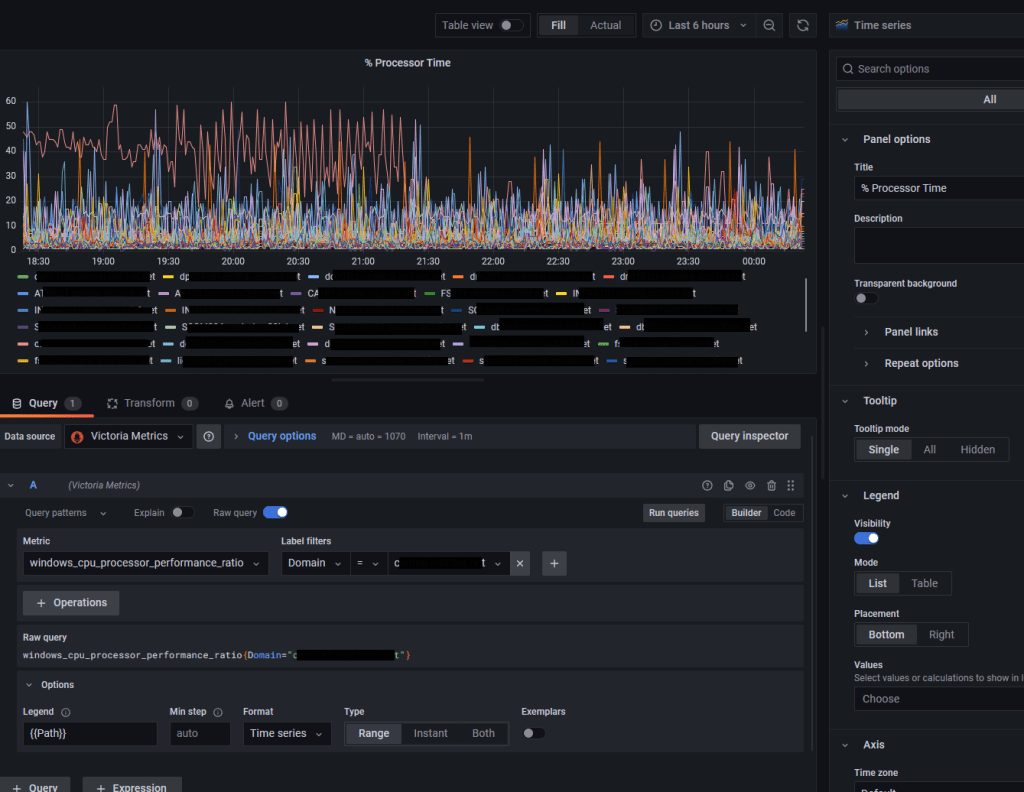
windows_system_uptime_total{Counter="Uptime",Domain="domain3.name",Object="System",Path="servername1.domain3.name"} 1.085932e+06Grafana panel:
Conclusion
The article highlights some features of the ETL process that allows to gather performance data collected by Microsoft System Center Operations Manager (SCOM) agents and to put the data into Prometheus-like database to be shown on Grafana dashboards:
- tuning of SCOM performance collection rules;
- development of metrics;
- preparing data in SQL database with buffering;
- configuration of Windows services
There are no doubts some steps can be optimized and even be omitted, finally it depends on a specific case.

Leave a comment